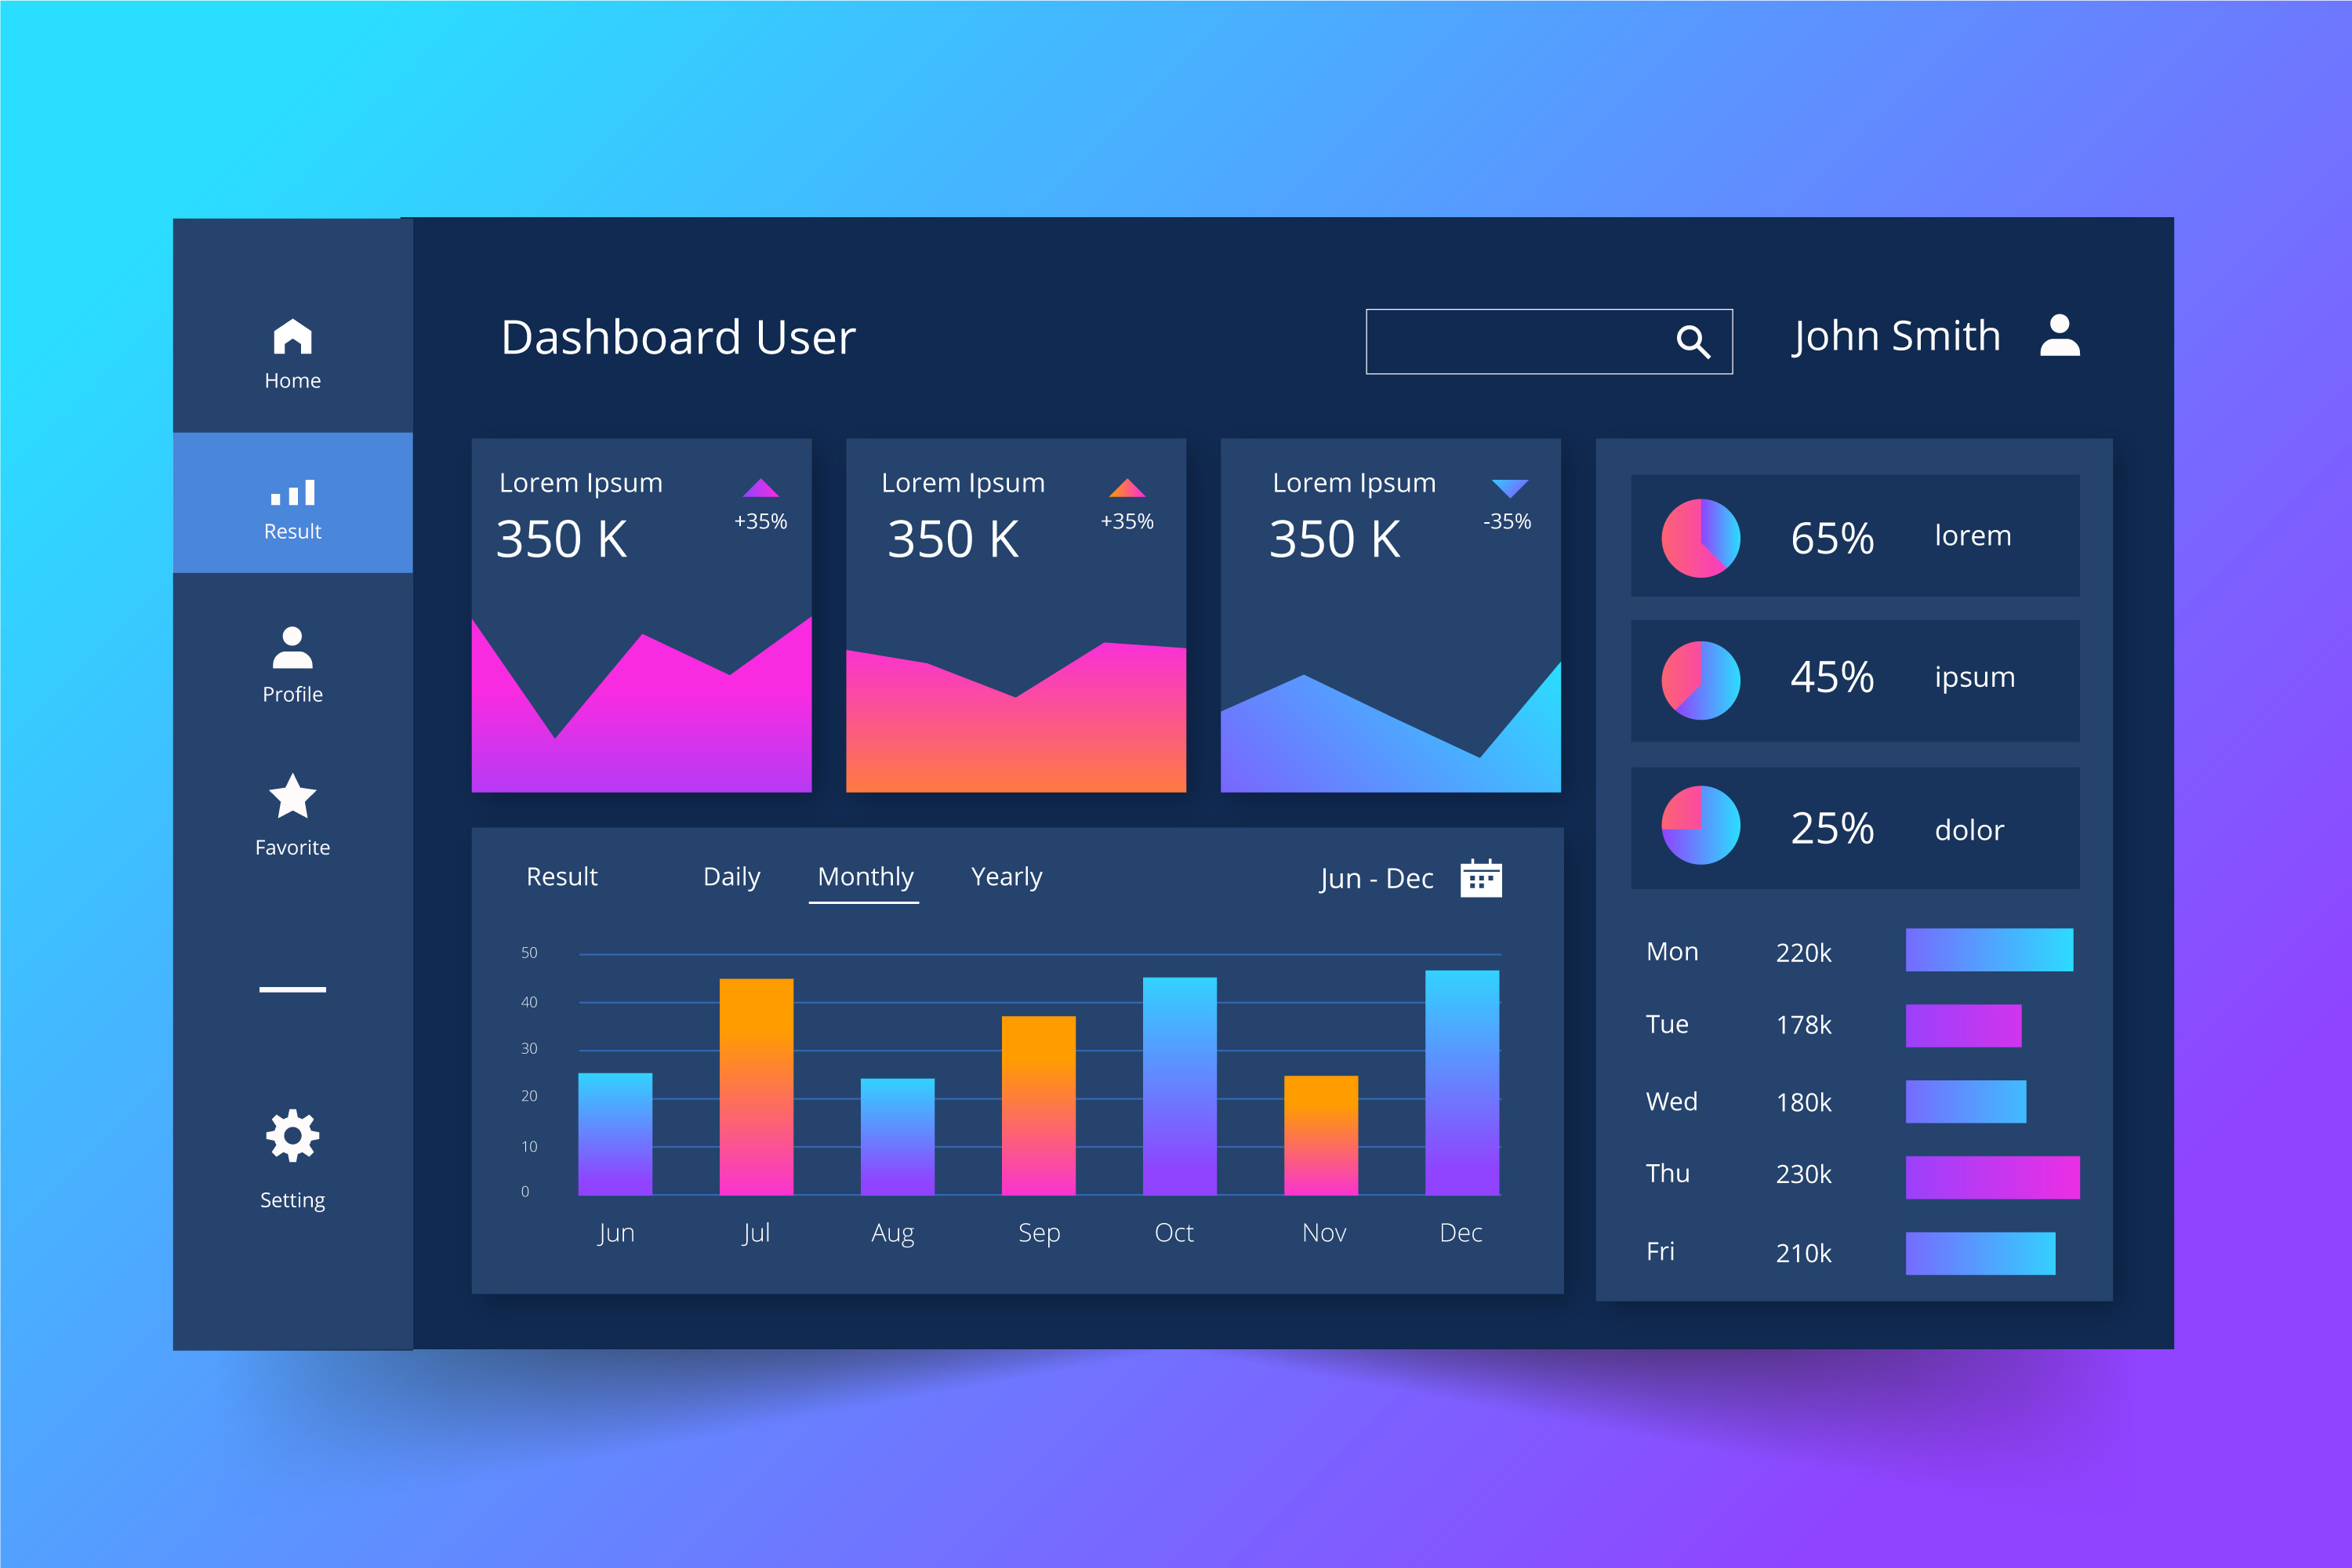
Data Analysis Dashboards-Transform Your Data with Powerful Dashboards
Unlock the full potential of your data with cutting-edge dashboard solutions that turn complex information into actionable insights.
Power BI Dashboards

Leverage the power of Microsoft’s leading analytics tool to create dynamic, interactive dashboards that provide real-time insights into your business metrics.
Python Streamlit Dashboards

Create beautiful, custom web apps for data analysis with Python Streamlit, enabling seamless visualization and interactive exploration of your data.
Node.js Dashboards

Build scalable, high-performance dashboards with Node.js that process and visualize data in real-time, ensuring you’re always up to date.
Tableau Dashboards

Transform your raw data into powerful visual insights with Tableau, helping you uncover trends and make data-driven decisions with ease.
Excel Dashboards

Maximize the potential of Excel with advanced dashboards that integrate seamlessly with your existing data, providing familiar yet powerful analytics capabilities.
Value-Added Services
Enhancing your business intelligence with value-added services.
Real-Time Data Integration
We integrate real-time data feeds into your dashboards, ensuring that you always have the latest information at your fingertips.
Data Security
Our dashboards are built with robust security features to protect your sensitive data, ensuring that only authorized users have access.
Customizable Solutions
We tailor our dashboards to meet your specific business needs, providing customizable solutions that fit seamlessly into your existing workflows.
Frequently Asked Questions
Find answers to common questions about our data analysis dashboard services.
At SAC Consulting Services, we are committed to integrating AI to streamline your business operations. Reach out to learn more about how our AI-driven solutions can benefit you.